Here's the August 4th article from the National Snow and Ice Data Center. It shows the ice melting at a record pace. But, for Fiona's trip this is a two-edged sword. The warm weather is dislodging old ice that normally survives year to year. This ice starts to migrate and can clog up passages that are normally open.
Arctic sea ice extent for the month of July was the third lowest for that month in the satellite record, after 2007 and 2006. The average rate of melt in July 2009 was nearly identical to that of July 2007. A strong high-pressure system, similar to the atmospheric pattern that dominated the summer of 2007, brought warm winds and clear skies to the western Arctic, promoting ice melt.
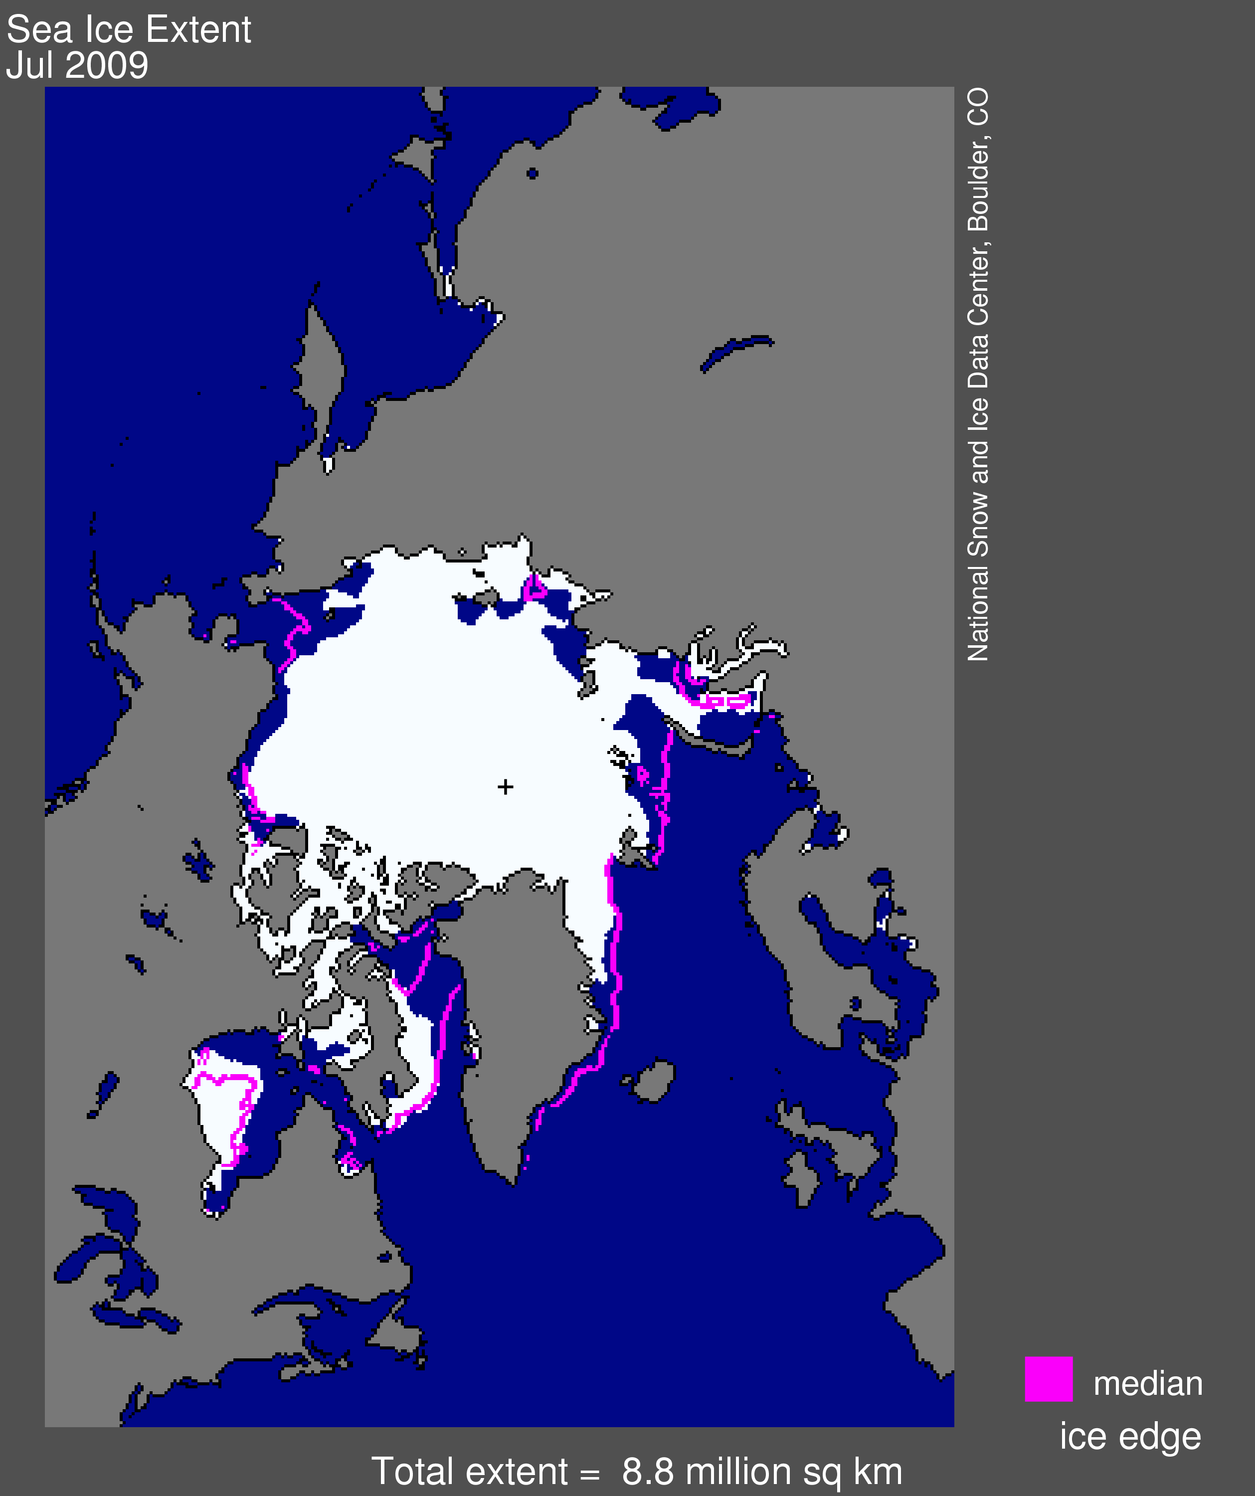 Figure 1. Arctic sea ice extent for July 2009 was 8.81 million square kilometers (3.40 million square miles). The magenta line shows the 1979 to 2000 median extent for that month. The black cross indicates the geographic North Pole. Sea Ice Index data. About the data.
 —Credit: National Snow and Ice Data Center
High-resolution image
Overview of conditions
Sea ice extent averaged over the month of July 2009 was 8.81 million square kilometers (3.40 million square miles). This was 680,000 square kilometers (263,000 square miles) above the record low that occurred in July 2007, 250,000 square kilometers (97,000 square miles) below July 2008, and 1.29 million square kilometers (498,000 square miles) below the 1979 to 2000 average. Sea ice extent is unusually low in the Kara Sea, Baffin Bay, and along the Russian coast. The only area with significant above-average ice extent is southern Hudson Bay.
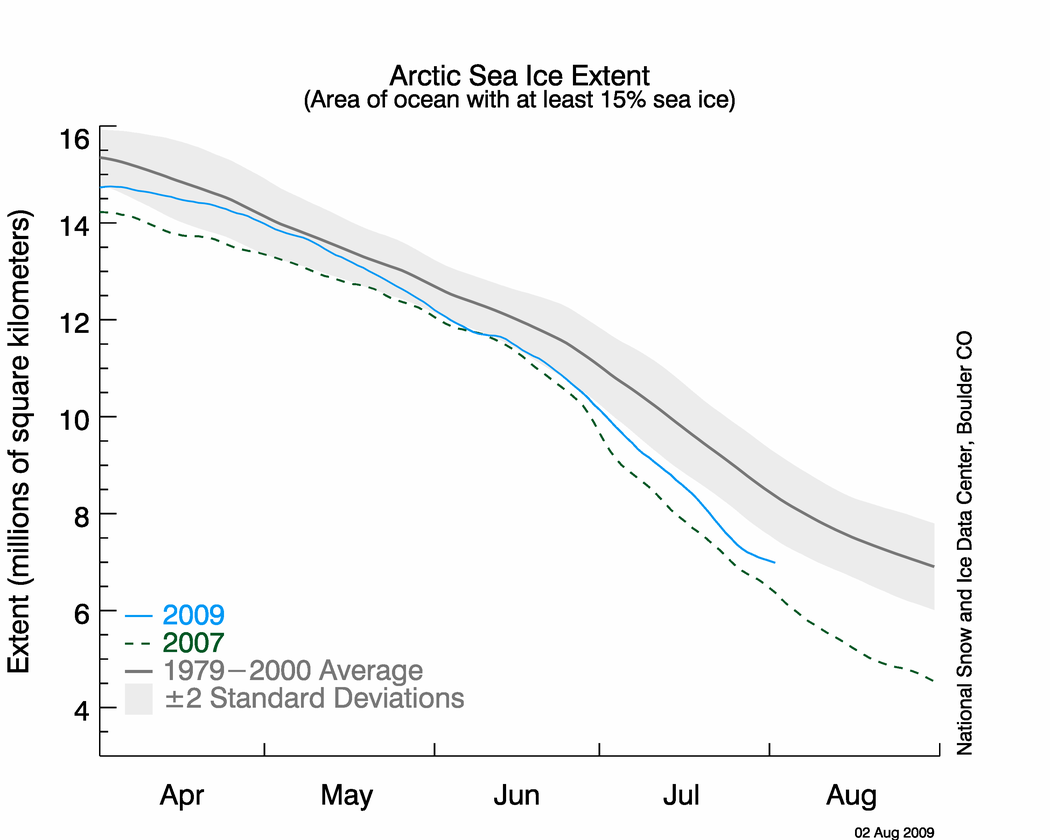 Figure 2. The graph above shows daily sea ice extent as of August 2, 2009. The solid blue line indicates 2009; the dashed green line shows 2007; and the solid gray line indicates average extent from 1979 to 2000. The gray area around the average line shows the two standard deviation range of the data. Sea Ice Index data.
—Credit: National Snow and Ice Data Center
High-resolution image
Conditions in context
The average pace of ice loss during July 2009 was nearly identical to that of July 2007. Ice loss sped up during the third week of July, and slowed again during the last few days of the month.
Averaged for the month, July 2009 saw a decline rate in ice extent of 106,000 square kilometers (41,000 square miles) per day. For comparison, the rate of decline for July 2007 was 107,000 square kilometers (41,000 square miles) per day and the July 2008 rate of decline was 94,000 square kilometers (36,000 square miles) per day. The Arctic Ocean lost a total of 3.19 million square kilometers (1.23 million square miles) of ice during July 2009, and dropped below ice extent at this time in 2008.


No comments:
Post a Comment